Troubleshooting Visual Studio Debugger: Code Not Hitting Breakpoints
- The code is not executing:- Make sure that the code you are trying to debug is actually being executed. Check if the breakpoints are set at the correct locations and that the code path is being followed.
- The code is in a different thread:- If the code is running in a different thread than the one you are debugging, the debugger may not hit the breakpoints. Make sure that you are debugging the correct thread.
- The breakpoint is disabled:- Make sure that the breakpoint is not disabled. You can check this by right-clicking on the breakpoint and selecting "Enable Breakpoint".
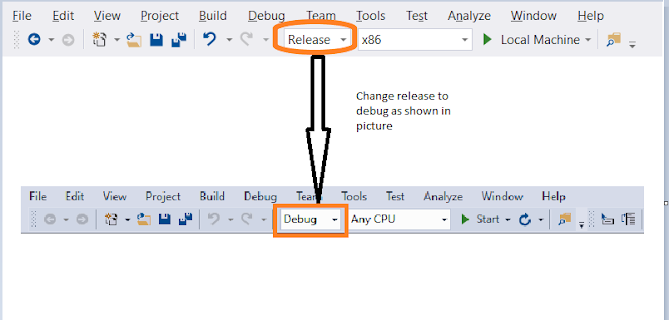
- The code is running in Release mode:- Debugging in Release mode is often disabled by default. You can change the build configuration to Debug mode to enable debugging.

- The code has been optimized:- If the code has been optimized, the debugger may not be able to hit the breakpoints. To disable optimization, go to Project Properties > Build > Advanced > Output > Debug Info and select "Full" instead of "pdb-only".

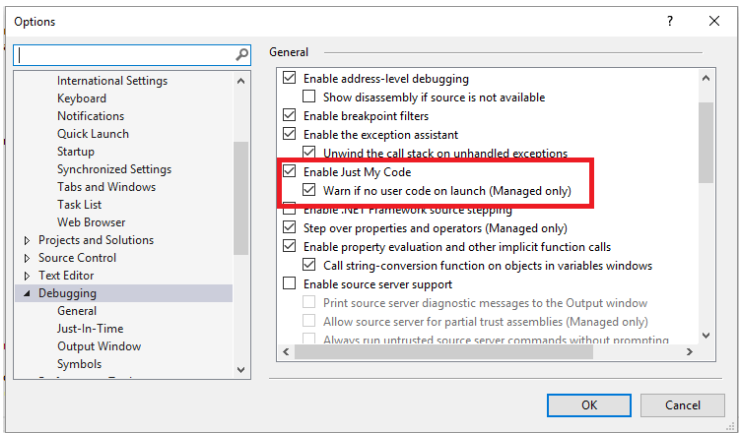
Just My Code:- Just My Code is a debugging setting that controls whether the debugger stops only at user code or also at system code. If Just My Code is enabled, the debugger will only stop at breakpoints in user code, while if it's disabled, the debugger will also stop at breakpoints in system code. To enable or disable Just My Code, go to Tools > Options > Debugging > General, and check or uncheck "Enable Just My Code".
- Debugger Type:- Visual Studio supports different types of debuggers, such as the native debugger for C++ code, the managed debugger for .NET code, and the JavaScript debugger for web applications. To select the debugger type, go to Debug > [your project name] Properties > Debugging, and choose the appropriate debugger type from the "Debugger Type" dropdown.
- Symbol Server:- A symbol server is a server that stores debug symbol files, which are needed by the debugger to map executable code to source code. Visual Studio can be configured to use a symbol server to automatically download missing symbol files. To configure the symbol server settings, go to Tools > Options > Debugging > Symbols, and enter the symbol server URL and other settings.
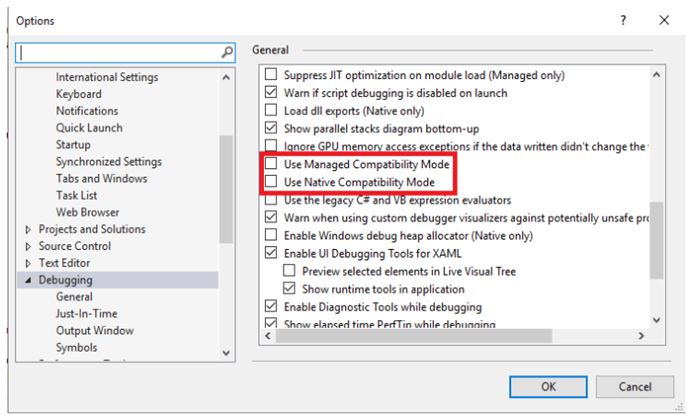
- Enable Use Managed Compatibility mode, and Use Native Compatibility Mode:
- Try to Replace .vs folder or delete .vs folder from project.
- Import export .vs settings:-


- Go to tools and click on Import and Export settings.

- If debugger not working then import .vs setting from another project or old project and export .vs in new repository project.


